One of the most reasonable questions an investor can ask about a private credit fund is this:
If the underlying loans pay approximately 8.4%, how can the fund expect to produce an 11–12% net return for investors?
The answer is that a loan’s coupon is only one component of the fund’s return.
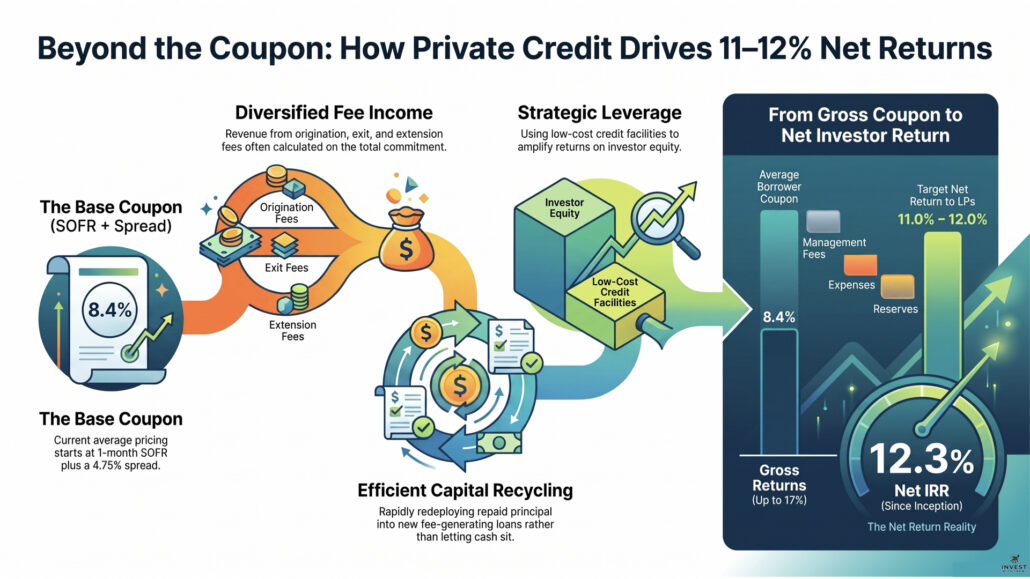
Our average loan pricing is currently one-month SOFR plus 4.75%, although individual loans may price higher based on their structure, leverage, complexity, collateral, and risk. At current benchmark rates, that translates into borrower coupons beginning at approximately 8.4%.
The fund’s expected net return to limited partners is 11–12%. Through the first quarter of 2026, the fund generated a 12.3% net internal rate of return since inception.
That difference is produced by four primary sources: interest income, fee income, efficient capital deployment, and modest leverage.
The Coupon Is the Starting Point
A floating-rate loan priced at one-month SOFR plus 4.75% adjusts periodically as the benchmark changes.
SOFR is a broad measure of the cost of borrowing cash overnight when secured by U.S. Treasury securities, according to the Federal Reserve Bank of New York. It is commonly used as the benchmark for floating-rate commercial loans.
If one-month SOFR is 3.65%, adding a 4.75% spread produces a borrower coupon of 8.4%.
That coupon is the contractual interest rate charged on the outstanding loan principal. It is not necessarily the lender’s complete return on the transaction, and it is not the same as the investor’s eventual net return from the fund.
Private Loans Generate Fee Income
Private lenders are paid not only for providing capital but also for originating, underwriting, structuring, administering, and extending loans.
Depending on the transaction, the lender may receive:
- Origination fees
- Underwriting or due-diligence fees
- Servicing or administration fees
- Exit fees
- Extension fees
- Modification fees
- Minimum-interest protection
Some of these fees compensate the fund for real expenses. Others represent additional revenue.
For example, assume a lender originates a $10 million loan charging a 1% origination fee. The borrower pays $100,000 at closing.
If the entire $10 million is immediately advanced, that fee adds 1% to the transaction’s gross return before considering the loan’s duration.
If only $6 million is initially advanced under a future-funded structure, however, the same $100,000 fee equals approximately 1.67% of the capital initially deployed.
The lender has committed to provide as much as $10 million, and therefore prices the fee on the total commitment. But until the borrower draws the remaining funds, the lender may have substantially less capital outstanding.
That difference can increase the effective return on capital actually deployed.
Capital Can Be Recycled More Than Once
Loan duration also matters.
Consider a condominium inventory loan. The lender finances a pool of completed units and earns a fee based on the original commitment. As the borrower sells individual units, a portion of the loan is repaid.
The fund can then redeploy that returned capital into another loan that generates a new coupon and a new set of origination fees.
A dollar of investor capital may therefore support more than one loan during a year.
This does not mean the same capital is being invested twice simultaneously. It means capital is being returned and recycled quickly rather than remaining tied up in one long-duration investment.
The faster capital can be prudently redeployed, the more fee-generating opportunities it may support.
The word prudently matters!
Rapid recycling only improves returns if underwriting standards remain consistent. Creating more loans is not valuable if loan quality deteriorates.
Modest Leverage Can Increase the Return on Equity
The fund may also use a credit facility or other modest leverage to finance a portion of its loan portfolio.
Suppose a fund earns 8.4% on a loan while borrowing part of the required capital at a lower rate. The difference between the loan income and the fund’s financing cost accrues to the fund’s equity investors after expenses.
This can increase the return earned on LP capital.
But leverage is not free return. It also magnifies risk.
The fund must pay its financing cost even if a borrower stops paying. A credit facility may include covenants, collateral requirements, or mark-to-market provisions. Excessive leverage can turn a manageable loan problem into a fund-level liquidity problem.
For that reason, the relevant question is not simply whether a fund uses leverage. Investors should ask how much it uses, what it costs, whether the lender has recourse to the fund, and what could trigger a reduction in availability or forced repayment.
Gross Return Is Not Net Return
A future-funded loan combining an 8.4% coupon, fees on the total commitment, efficient capital deployment, and modest leverage can produce a gross return materially above the stated coupon. Under the right assumptions, gross transaction-level returns can exceed 17%.
That does not mean every 8.4% loan produces 17%, or that investors receive the gross return.
The fund must still account for:
- Credit-facility interest
- Operating and servicing expenses
- Management fees
- Organizational expenses
- Uninvested cash
- Loan losses or reserves
- Timing differences between income and distributions
What remains after applicable expenses and losses determines the net return available to investors.
The Number Investors Should Evaluate
Coupon rate, cash distribution yield, total return, and IRR are related, but they are not interchangeable.
The coupon tells you what the borrower pays on outstanding principal.
The fund’s gross return includes interest, fee income, recycling benefits, and any contribution from leverage.
The net return reflects what remains for investors after fund-level costs.
IRR also incorporates the timing of cash flows, so a since-inception net IRR of 12.3% should not automatically be interpreted as a 12.3% annual cash distribution.
Our 11–12% net return is an expectation based on the portfolio’s current pricing, structure, fee generation, leverage, expenses, and performance. The 12.3% net IRR through Q1 2026 represents past performance, not a guarantee of future results.
The important point is not that an 8.4% coupon somehow becomes 12% through financial alchemy.
It is that professionally structured private lending produces revenue in several ways—and the coupon is only the first line of the return calculation.